


September 2025
By Dr. Amy Kaplan-Zattler, DACVECC, MRCVS, VETgirl’s CE Program Manager
In this VETgirl online veterinary continuing education blog, Dr. Amy Kaplan-Zattler, DACVECC, MRCVS, VETgirl’s CE Program Manager, reviews what you need to know about medical statistics when it comes to critically reviewing a peer-reviewed, scientific journal article. What do you need to know as a veterinary professional when it comes to statistics and why do you care? Missed Part 1? Check it out HERE before reading Part 2.
Evaluating Medical Journal Articles With Curiosity and Confidence: Part 2 of 2
Does anyone else ever feel like statistics should be considered a foreign language? It’s like a mixture of math and buzzwords, but I feel I’m missing a decoder ring to interpret them. And then there’s so many different kinds of stats; it’s not one-size-fits-all, so how do we make sense of it all? Whether you’re a veterinarian, veterinary technician, veterinary student, or just a curious reader, mastering basic medical statistics is a skill worth having. It can help us interpret and talk about data from veterinary studies, which could potentially influence things like the diagnostic tests we choose or the prognostic advice we give to pet owners.
Heads up – I’m NOT a statistician! This VETgirl blog isn’t a deep dive into statistics but more like a superficial refresher to help us feel more comfortable with common terms and tests. So let’s break it down into digestible bites and tackle these medical stats with confidence!

Image by Carlos Bohorquez from Pixabay
Why do we use stats in medical research?
Stats may look incredibly confusing, and you may be asking “Why do we even need them?!” Well, it’s because medicine is practiced in shades of gray, so statistical tests help researchers make sense of data by turning their relationships into something more black-and-white. Let’s say you’re testing a new heart medication, and low and behold, it seems to affect heart rate. But how do we know that this small change didn’t just happen as some kind of random coincidence? That’s where stats come in! Statistical tests can tell us the likelihood that this change in heart rate was due to random chance, and if that possibility is small, then we’re more likely to believe the medication is what truly caused the difference. In other words, it really helps us determine the “strength” of the data and paper.
Decoder Ring of Terms
Let’s review some of the basic statistic terms before diving into the types of statistical analyses and how to apply them:
- Randomized: Subjects are randomly assigned to treatment groups to limit subject bias.
- Single-blinded: The person performing data collection is unaware of which treatment the subjects receive; this reduces owner/clinician bias.
- Double-blinded: Both the person administering the treatment and the person collecting the data are unaware which treatment the subjects receive to reduce both owner and operator bias. This is the “strongest” and “purest” type of study, especially when subjects are also randomized into their groups.
- Parallel study: Each subject receives only one product.
- Crossover study: Subjects receive each product at different times, with a washout period in between products; in this design, a subject can act as their own “control.” This type of study is challenging to perform in veterinary medicine, except in larger funded studies, due to the complexities of needing adequate washout periods, animal stress and compliance, owner compliance, and difficulties in obtaining a well-matched sample size.
- Categorical or Qualitative Data: Descriptive data such as breed, gender, health status, etc.
- Quantitative Data: Measured data such as temperature, blood pressure, weight, etc.
- Mean (Average): The average of a dataset. This is calculated by adding up all values and then dividing by the total number of values.
- Median: The middle value within a dataset.
- Standard Deviation (SD): This tells us how spread out the numbers are from the mean of your dataset. A small SD means your data points are close to the mean, whereas a large SD means they are more spread out.
- Accuracy: How close a measurement is to the true value. Example: A patient’s systolic blood pressure (SBP) is measured at 100 mmHg by Doppler and 101 mmHg by the gold-standard invasive (arterial) BP method, showing that Doppler provides an “accurate” SBP measurement.
- Precision: How consistent multiple readings are. Example: An oscillometric blood pressure cuff provides measurements of 110, 112, 111 mmHg, showing good precision because the values are all so close to one another over repeated testing.
- P-value: Shows how likely it is that a result happened by chance. A lower p-value (<0.05) means the result is statistically significant, so it’s less likely to have occurred by random chance and more likely to have been caused by the treatment. Be cautious when something is described as “approaching clinical significance.” This statement can be misleading and may overstate the importance of a result. After all, scientists chose a p-value cutoff of < 0.05 for a reason! It’s possible that a follow-on study with some adjustments could reveal a true significance, but it’s important to note that this particular study did not prove statistical significance.
- Confidence Interval (CI): Typically expressed at a 95% confidence level, it’s the range within which we expect our result to fall 95% of the time.
Let’s put together a quick fictional scenario using these terms. Say we’re measuring the average body weight of 5-month-old Golden Retrievers. After weighing 5 puppies at this age, here’s our data:

One Test to Rule Them All?
Unfortunately, there’s no universal statistical analysis test to match all study designs. Instead, we choose a test based on the type of data (e.g., categorical or quantitative), the number of samples being studied, and the goal – whether we’re comparing data, looking for a relationship within the data, or predicting outcomes.

Categorical data testing:
- Chi-Square test: Compares categorical data such as canine breed with incidence of hip dysplasia across a large sample size. (Fischer’s test may be used similarly for smaller sample sizes.)
- Two-Proportion Z-test: Compares two groups based on categorical outcome (e.g., survival, mortality) to see if there’s a statistically significant difference in their proportions. For example, if 60% of Group A and 40% of Group B are cured by a treatment, this test will tell us how likely it is that this difference in cure rates happened by random chance. A low likelihood would suggest that the higher cure rate in Group A compared to Group B is a real finding, likely due to the treatment.
Quantitative data testing:
- T-test: Determines whether a difference in a measurement (such as heart rate, blood pressure, body weight, etc.) is a real finding or, instead, due to random chance. In other words, did a change in body weight actually occur, or was it just a random fluctuation?
- One-sample t-test: Compares a single measurement to a known standard. An example could be testing to see if the administration of a canine drug produces elevated resting heart rates compared to the known average standard for canine resting heart rates.
- Paired t-test: Compares two measurements from the same subjects (e.g., before and after treatments). For example, this test could compare the mean resting heart rates of a group of dogs before and after giving them a heart medication to check if the difference is statistically significant, which would suggest the treatment had an effect on their resting heart rates.
- Independent t-test: Compares a single measurement between 2 different groups (e.g., treatment vs. placebo) to determine if there is a significant difference. For example, this test could compare the mean resting heart rate of 2 groups of dogs – one group receiving a heart medication and the other receiving placebo. If the difference in mean heart rate between the 2 groups is statistically significant, it would suggest that the treatment had an effect on resting heart rate.
- Analysis of Variance (ANOVA): Compares the means of 3 or more groups to determine if there is a statistical difference among them. For example, this test could compare the mean dose of propofol needed for intubation in dogs given 1 of 3 different premedication cocktails to see which cocktail significantly decreases the amount of propofol required.
Correlation & Regression: Sometimes, we’re not looking at cause and effect but rather looking to see if two variables share a relationship. For example, is there any relationship between exercise and heart rate, or are these two factors completely independent of one another?
- Correlation: Measures how strongly 2 variables are linked.
- Pearson’s correlation coefficient (r): Tells us how one variable acts in relation to the other in the following way:
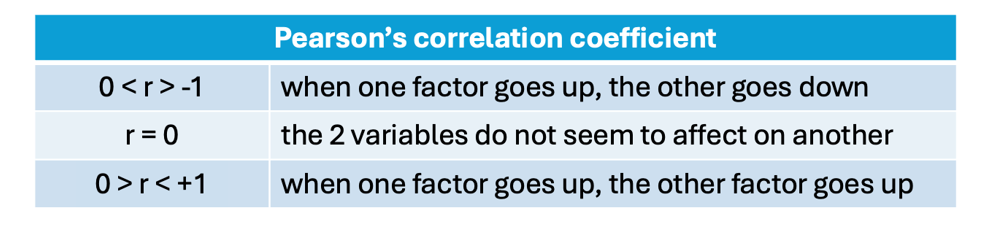
- Regression: Gives more information about how one variable affects the other and can potentially be used to predict values.
From Data to Decisions

To put this all in context, Dr. Steven Epstein, DACVECC, a professor at UC Davis, shares helpful tips with the veterinary community regarding the real-world implementation of statistics. In his podcast, I Don’t Think That Paper Means What You Think It Does!, he starts by reviewing the p-value (remember, this value helps us determine if results are likely due to chance.) If a p-value is < 0.05, we usually consider the finding statistically significant, meaning there’s a less than 5% chance the results happened randomly. However, when we put this number into real-world context, it suggests that if you had 20 similar studies, all showing a p-value of 0.05, then one of those studies would likely be incorrect according to the math. Whether that’s clinically concerning or not is another question, but it highlights the need for caution in how we apply these numbers to our patients.
Other familiar terms that may have lost some of their true meaning in real-world context are “sensitivity” and “specificity”:
- Sensitivity is how well a test can detect disease. Higher sensitivity means lower false negatives.
- Specificity is how well a test identifies healthy cases. Higher specificity means lower false positives.
Sometimes, we may place too much emphasis on the numeric value of these terms without fully understanding their real-world context. These terms are used in validating diagnostic tests, but sometimes, their values can trip us up when we’re interpreting a patient’s test results. For example, if you get a positive result on a patient’s screening test that has a high specificity (less likely to give a false positive), but your patient’s symptoms don’t seem to fit the disease, do we trust the results anyway? Do we start this patient on treatment? It’s important to remember that even a test with high specificity or high sensitivity isn’t always 100% accurate. Sometimes, results fall within that narrow margin of being a “false positive” or “false negative.” We can increase our confidence in a test result by considering how common the disease is in our area or patient population- this is the “prevalence” of a disease. Prevalence helps us better understand the positive and negative predictive values of a test, which are more clinically helpful to us than perhaps the sensitivity and specificity of a test are alone:
- Positive predictive value is the chance a positive result is truly positive.
- Negative predictive value is the chance that a negative result is truly negative.
- Prevalence is calculated by the sum of true positives and false negatives in a population divided by the total population.
Both “predictive values” and “prognostic values” might sound like similar terms, but it’s important to know their differences when interpreting data. Prognostic values estimate a patient’s risk of something based on factors like the patient’s age or disease severity, while predictive values tell us how likely a test result (like that tabletop snap test) is to be accurate. Understanding this difference is crucial when discussing diagnosis and treatment options with pet owners.
Beyond the statistical buzzwords, it’s essential to also focus on whether a study’s design and selected statistical analysis method can truly answer the research question. For many studies, this comes down to a game of numbers- how many subjects are included in the study. For a study to confidently say, “We found no difference,” a study needs a large, well-matched sample size. This can be tough in veterinary research, where it’s hard to find enough subjects with similar characteristics, like age and health status, while keeping treatment variables controlled. For example, a study that only has enough subjects to achieve 80% power means the findings are likely to be accurate only 80% of the time. But this still means there’s a 20% chance of missing the mark completely, which can be pretty clinically significant in some situations, especially in critical cases!

To wrap it all up, statistics can absolutely feel overwhelming, but having a solid grasp of the basics is a powerful tool for your veterinary toolkit! Once you understand what these tests and numbers are telling us about the data, you’ll be better equipped to interpret research findings. This knowledge helps you confidently assess whether a study’s analysis truly supports its conclusions, making you better equipped to decide if new information should influence how you practice medicine. So, let’s take on the challenge of gaining confidence with statistics, keep these definitions handy, and dive into the research!
References:
- Pezzulo JC. Biostatistics for Dummies. Hoboken, NJ: For Dummies, a Wiley Brand, 2013.
- Epstein S. “IVECCS Live Sessions: I Don’t Think That Paper Means What You Think It Does!” The Vet Vault, hosted by Hubert Hiemstra, 2024.
Only VETgirl members can leave comments. Sign In or Join VETgirl now!


Test comment
Test comment 2